Phase rotation in the original source is not the cause. Hyper-compression is.
It appears that hyper-compression induces large amounts of odd-order distortion that, when allpassed (or simply undergoes phase rotation) causes peaks to grow in level.
I confirmed this with a track I hyper-compressed myself and then analyzed using a tool called Mastering Visualizer, "MasVis." http://www.lts.a.se/lts/masvis
MasVis has a display that they call "allpassed crest factor" which they claim is an indirect measure of "crush."
The dashed line is the crest factor of the original file, the second curve the crest factor vs. frequency after allpass.
The following MasVis animation shows THAT's Test Track 37, "Funky Bass" unprocessed, limited 20:1 @-9dB and normalized, and then with two degrees of hyper-compression:
Animation showing THAT's Test Track 37, "Funky Bass" unprocessed, limited 20:1 @-9dB and normalized, and then with two degrees of hyper-compression.
As clipping increases note the spread between the file's crest factor and the allpassed crest factor.
MasVis write:
Allpassed crest factor
This graph probably is the most revealing graph in MasVis. It gives an estimate of how much the crest factor has been lowered by processing of the 2-channel master. In the graph, there are four curves, two red for the right channel, and two blue for the left channel. The dashed line shows the crest factor, ie the same information as above the waveform graphs. The solid line shows the crest factor of the signal after it has passed an allpass filter. This second crest factor is a rough, and typically underestimated value of how large the crest factor was prior to level maximation of the 2-channel master.
At first, it may seem impossible to make such an estimate, but experience shows that the method works. Of course it does not give an exact value of the original crest factor, but it is good enough to tell when the track has been subjected to destructive loudness maximation.
The difference between maximum in the solid line and the dashed line correlates quite well with the amount of crest factor loss that is a result of level maximation of the 2-channel mix.
Here is the method that MasVis uses to make the graph:
1. Draw a dashed line at the crest factor of the track.
2. Run the track through seven different first order allpass filters at 20, 60, 200, 600, 2000, 6000 and 20000 Hz
3. For each of the seven filtered signals, calculate a new crest factor value
4. Plot a solid line representing the crest factors of the seven signals as a function of filter frequency
Apparently, when the odd harmonic artifacts of hyper-compression are phase rotated (or undergo any significant phase shift) the peaks are no longer folded inward but instead fold outward causing an increase in peak level but not an increase in RMS.
I also ran some tests to see what the effects of RIAA pre-emphasis are on brickwalled material.
The peak level increases with brickwalled material are huge when inverse RIAA is applied.
And, as it turns out, MasVis' "allpassed crest factor" measurement correlates well with peak level growth with varying degrees of hyper-compression after inverse RIAA.
I ran the THAT 37 test suite and, sure enough, the original and lightly-limited didn't have the peak growth. The ones with hyper-compression do.
The amount of gain that had to be reduced prior to inverse RIAA correlated closely to MasVis allpassed crest factor.
The allpassed crest factor portion of the graph is small and requires some interpretation due to lack of a scale.
MasVis doesn't have inverse RIAA weighting so some visual fudging is required: The higher the center frequency of the allpassed crest factor the more it underestimated due to HF boost.
But its close.
First I normalized the four tracks downward by 0.25 dB to remove the 0 dBFS clips.
I applied inv RIAA EQ to each track and normalized it downward until I got just under 0 dBFS peaks.
(The unprocessed and limited file did not require normalization.)
The file with "+6 dB slam" required input normalization to -2 to prevent post-EQ clipping.
The +12 dB slam file require normalization to -8 to prevent post-EQ clipping.
For an equal post RIAA EQ peak level the lightly-limited file could be recorded 8 dB hotter than the highly-slammed one.
I can establish that inverse-RIAA'd brickwalled material will overshoot more than identical un-brickwalled material.
Put another way hyper-compressed files require large decreases in record level to maintain the same post-EQ peak level.
This is probably not news to any ME but I needed proof.
What are the consequences of increased peak level from the second-order EE?
Apparently very little after RIAA preemphasis.
Material which has not been brickwalled does not show significant peak level increases.
Files which have been brickwalled do..
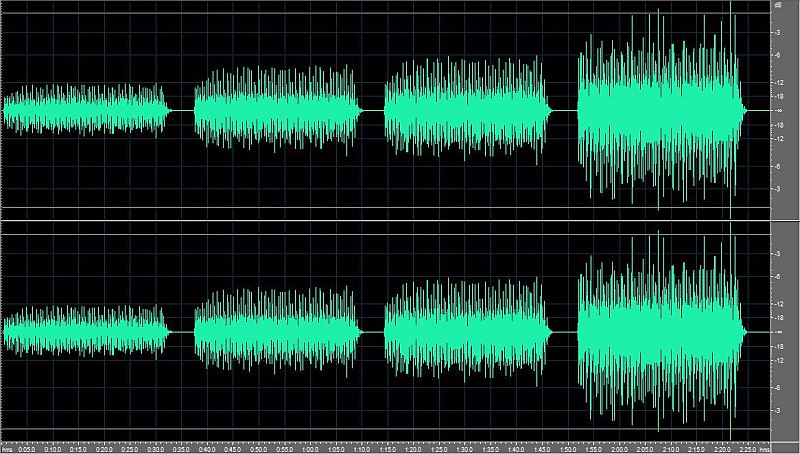
The first example are the files with no EE, a second order 300 Hz EE with time delay correction, and a first-order EE.
The expansion in peaks in the second-order example are significant.
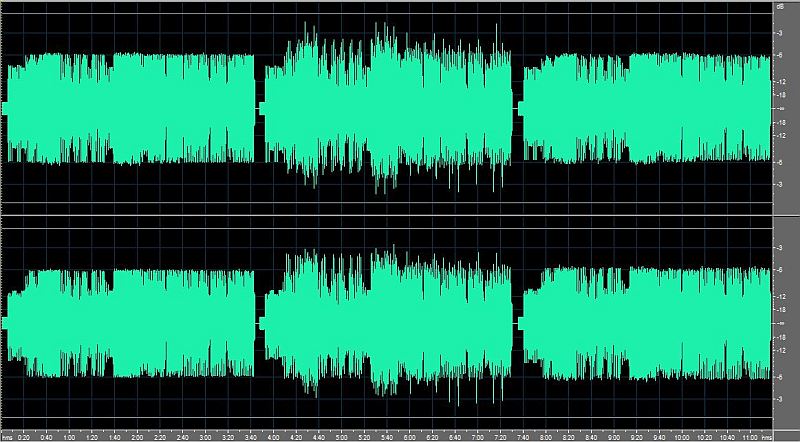
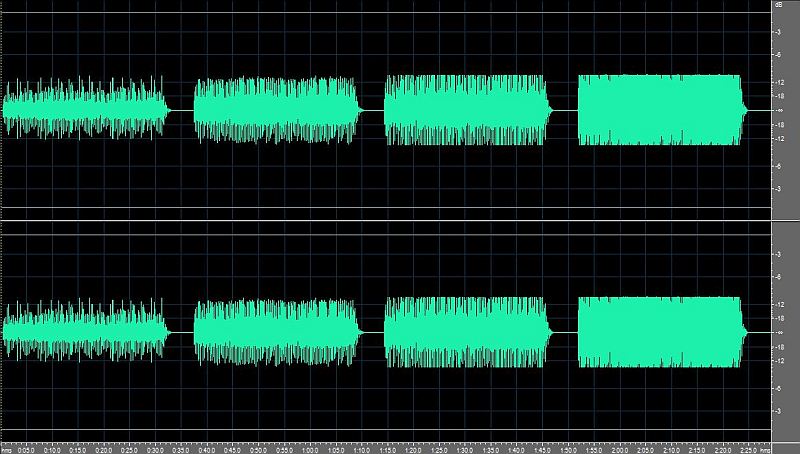
Daft Punk Harder Faster Stronger No EE, 300 Hz Second Order, 300 Hz First Order Comparison
When the same three segments are inverse RIAA equalized the differences almost disappear:

Daft Punk Harder Faster Stronger No EE, 300 Hz Second Order, 300 Hz First Order Comparison with Inverse RIAA applied.
The peak levels are:
-1.58 dB in the original
-0.79 dB in the 300 Hz Second-Order EE
-1.62 dB in the 300 Hz First-Order EE
About 0.8 dB more in the second-order EE.
The final difference may be due to the effect of EE which will steer LF Side to Mid.
Even though the second segment in the original looks hotter - and in terms of peak level it is - it is not significantly hotter after Inverse RIAA EQ.
The second-order EE "unwraps" the embedded peak overshoots but the RIAA pre-emphasized output does not have significantly increased peak level.
When inverse RIAA is applied to the output of the second-order EE, whose phase shift is at low frequencies, the peak increase isn't pronounced because LF are highly attenuated on the preemphasis curve.
What I think I might do is provide a means to bypass the "time delay correction" in Mid.
The user could ultimately have it three ways:
1) Single-order
2) Second-order with Mid delay correction (symmetric response)
3) Second-order without correction (asymmetric response)